How It Works
Workflows, Screenshots, and What We Built on the Fly
This companion document provides the practical detail behind Fieldtripping with AI. It covers three things: the workflow for each platform, the development workflow with AI, and a detailed account of what was designed, built, and deployed in real time during the live event.
Part 1: Melbourne Connections — Educator Workflow
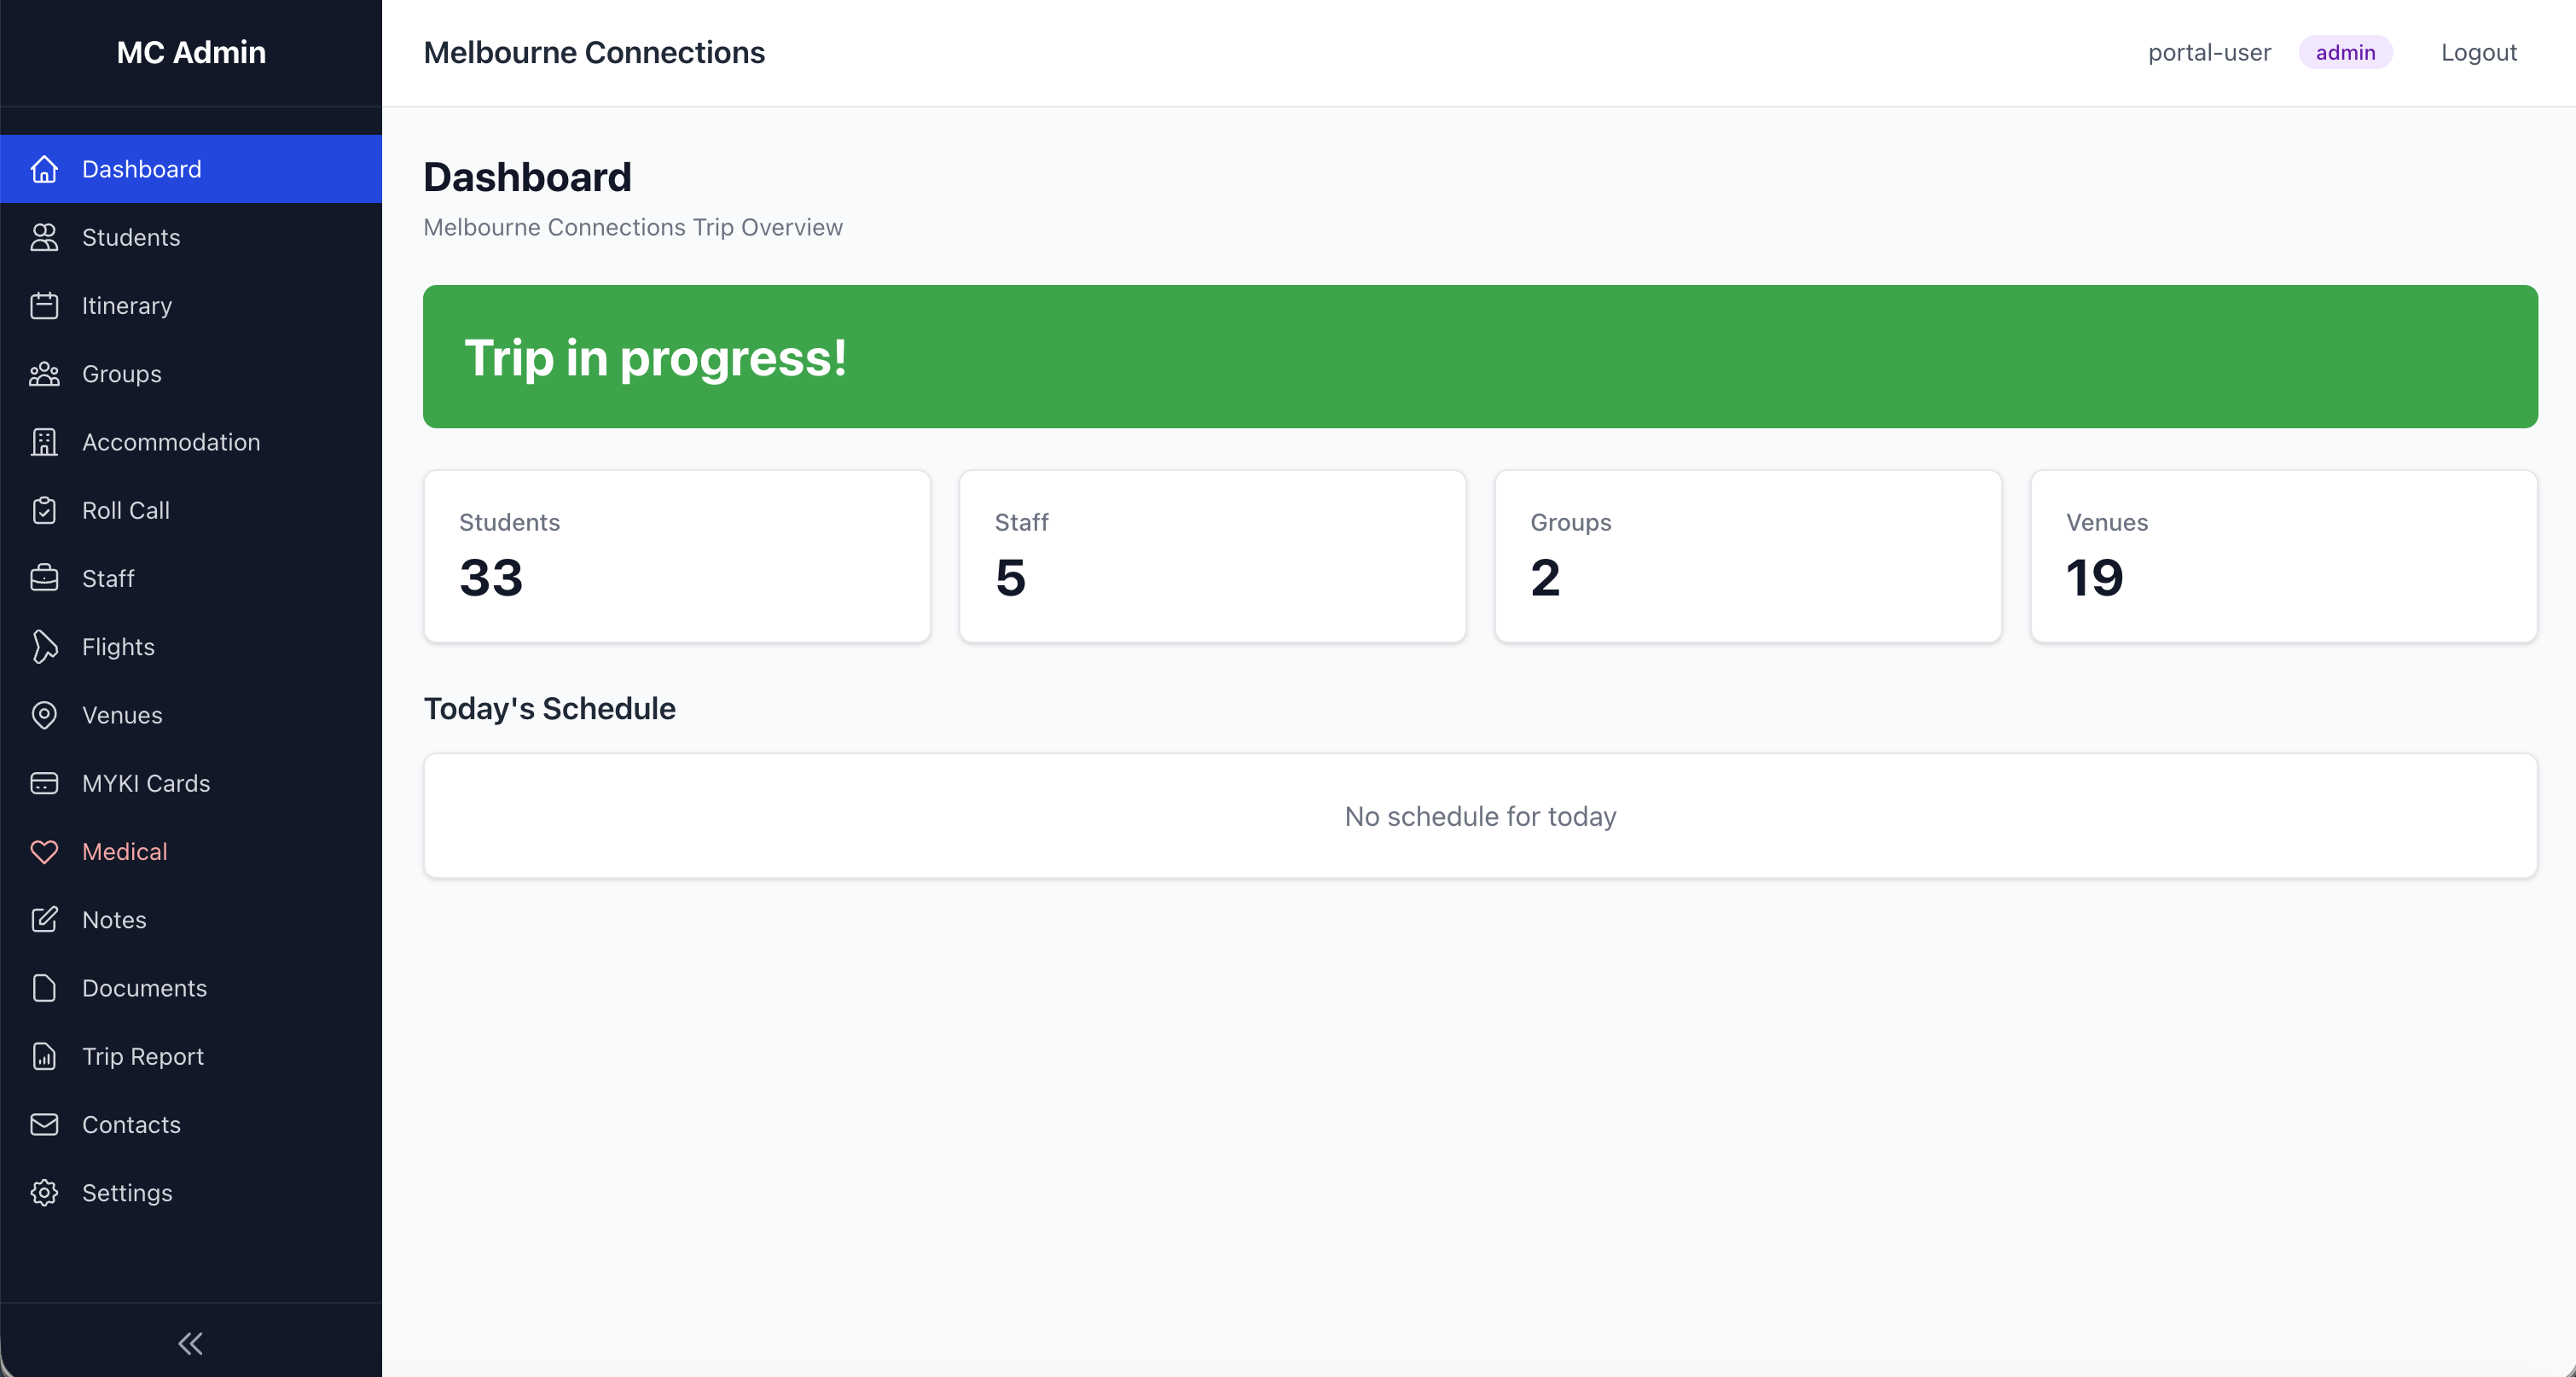
Melbourne Connections is the staff-facing trip management platform. It comprises two components: the Staff Companion app (a native iOS app for staff iPhones) and Explore Zones (a GPS boundary tool for student free-time). Here is how I set up and use each.
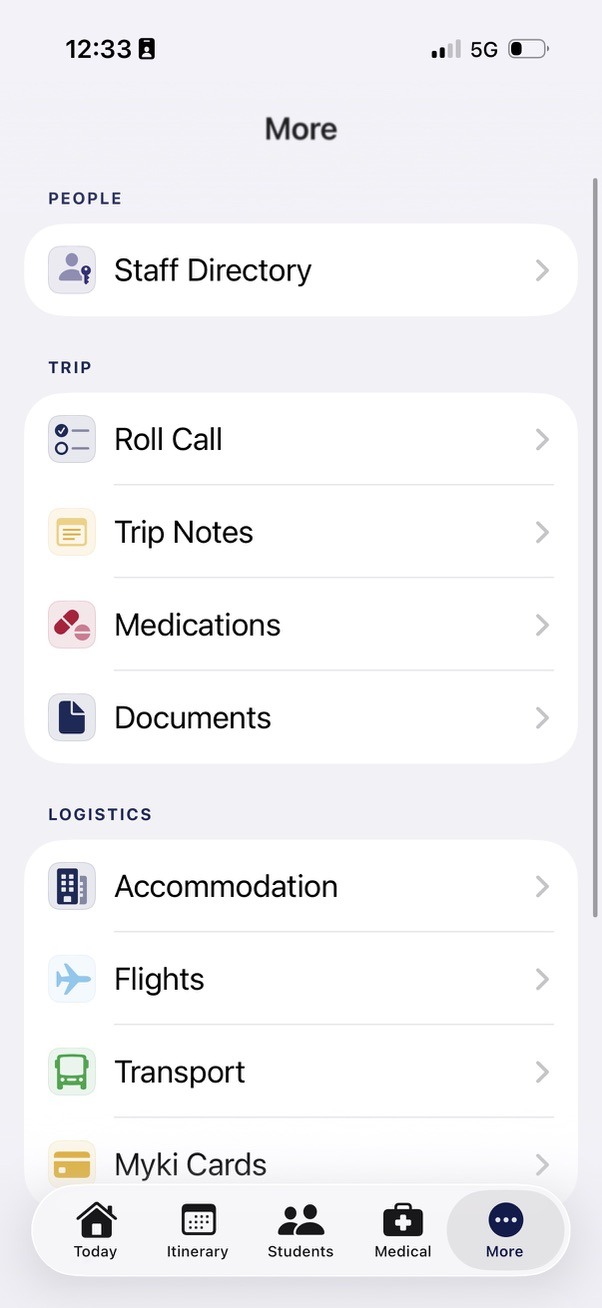
Staff Companion App
The Staff Companion is a native iOS app, built in Xcode with the help of Claude Code. It runs directly on staff iPhones with full offline capability, putting every piece of trip information in a staff member's pocket without relying on an internet connection.
Setup (Before the Trip)
Step 1: Ingest medical and personal data from school systems
The school's core systems already hold sensitive medical information, dietary requirements, and emergency contacts. Every modern school information system provides APIs — programmatic interfaces that allow other software to request data securely. Rather than manually retyping this information into spreadsheets (the traditional approach, which introduces transcription errors and produces documents that are stale the moment they are printed), the AI helped me connect to these APIs directly, pulling the data encrypted and transforming it into the formats the app needs.
The security architecture for this integration was itself designed in partnership with the AI. Claude helped design a workflow where API authentication credentials are stored securely in environment variables on my local machine — never hardcoded into the project files, never committed to version control, and never visible in the codebase itself. The AI guided best-practice deployment procedures: the data ingestion script runs locally on my secured machine, authenticates against the school's API using tokenised credentials, retrieves only the specific data fields required (medical, dietary, emergency contacts), encrypts the output, and bundles it into the Xcode project for compilation. At no point does confidential authentication information pass through the AI or appear in any shared file. The AI designed the security model, wrote the integration code, and advised on deployment — but the actual credentials remained solely under my control. This means the sensitive data flowing into the app is always current, always accurate, and always handled according to the same security standards the school applies to its own systems.
Step 2: Prepare the data files
The app is built around structured data files bundled into the Xcode project: students, staff, schedule, and locations. Sensitive medical and personal data flows securely from the school's existing systems. Staff details, the itinerary, and venue information are maintained directly. I can describe changes to the AI partner who updates the data and rebuilds the app, or edit the data files directly in Xcode.
Step 3: Customise the itinerary
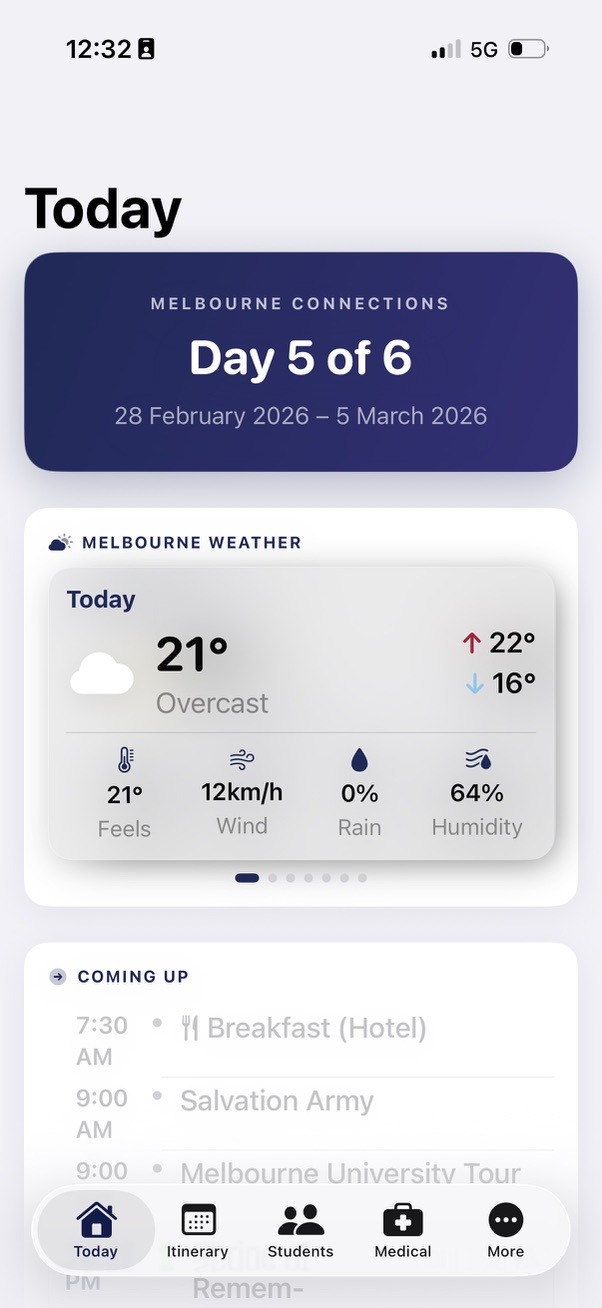
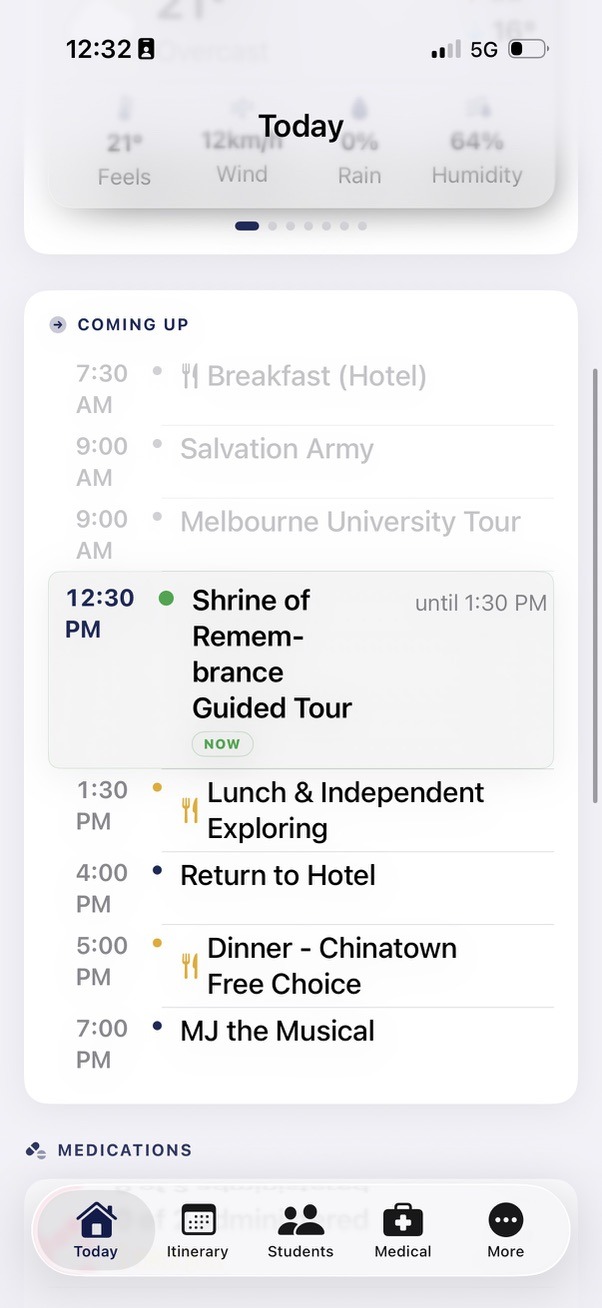
The schedule file holds every activity across the trip. Each entry has a date, start time, end time, location, description, and type (travel, activity, meal, free-time). The app automatically highlights the current and next activity based on the device clock, so staff always know where they should be.
Step 4: Review student information
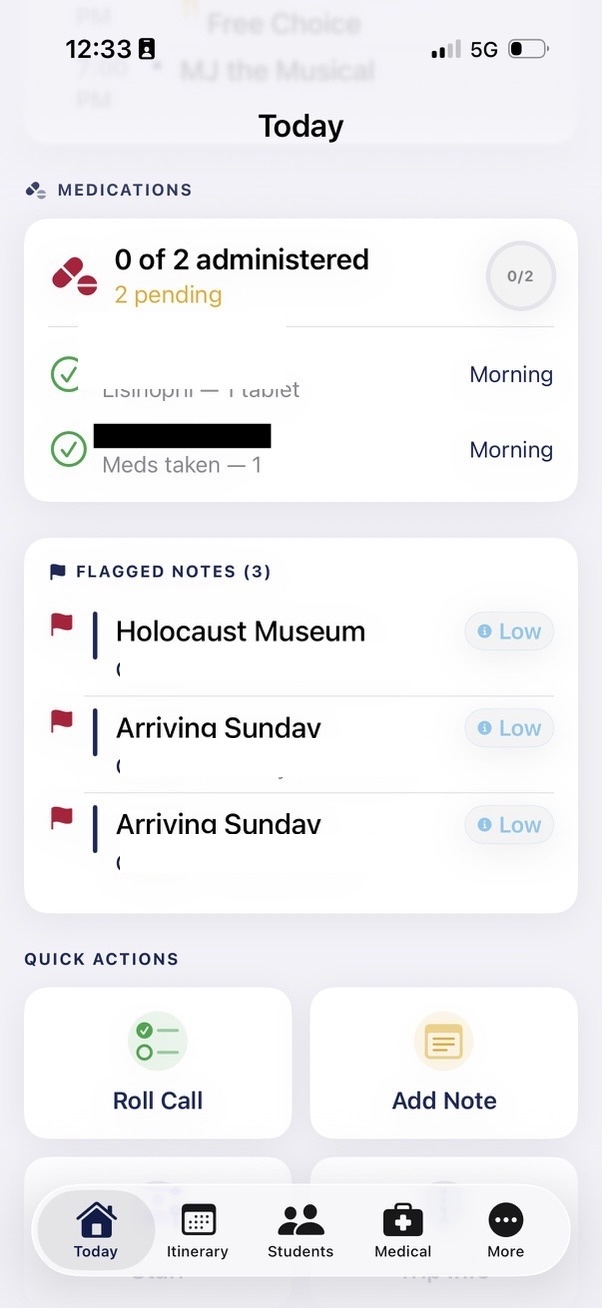
Student records include group allocation, room number, roommates, dietary requirements, medical notes, and emergency contact details. Review the data pulled from the school systems for accuracy. This information is bundled into the app and available to every staff member on every device, instantly, even offline.
Step 5: Install on staff devices
The app is built in Xcode and deployed to staff iPhones. As a native iOS app, all data is stored on-device and available offline from the moment of installation. Staff can test it before departure to confirm everything is correct. The native platform also enables direct integration with iOS features like phone calls, messages, and Apple Maps.
Daily Use (During the Trip)
Step 1: Morning roll call
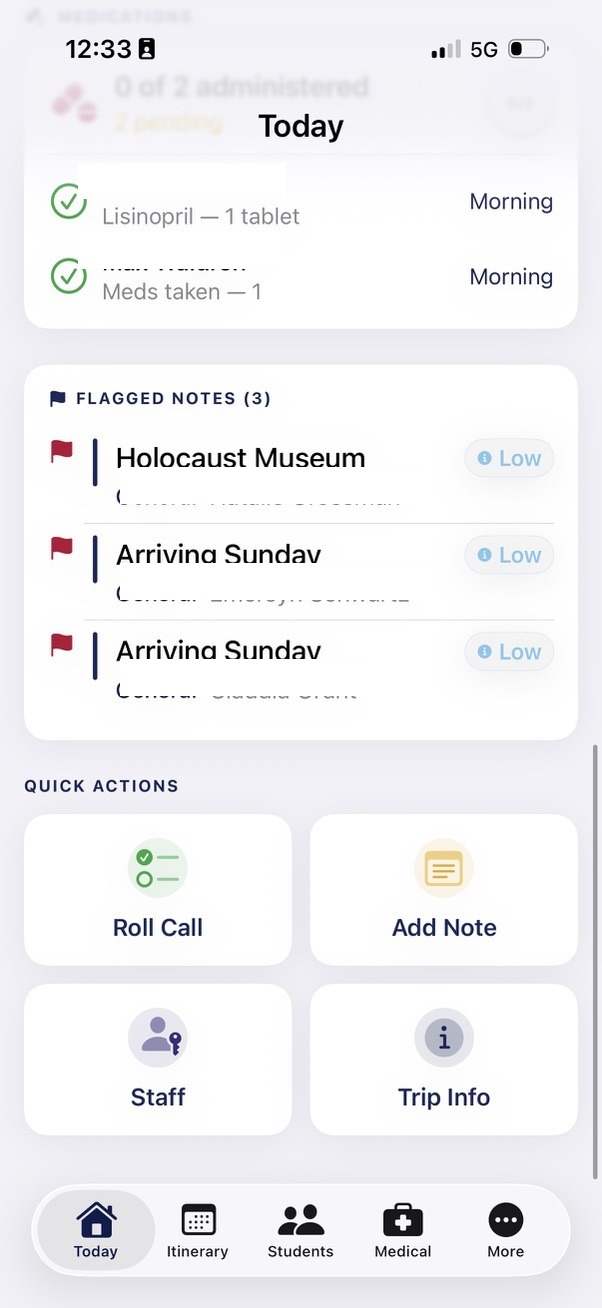
Open the Roll Call screen. Students are grouped by their assigned group (Group 1, Group 2). Tap individual names or use the "Check All" button. Add notes for any absences or issues. Tap "Save" to log the roll with a timestamp. The roll call history is stored on the device and can be emailed to the school office directly from the app.
Step 2: Restaurant arrival
Open the Student Directory. Filter by group if needed. The dietary and allergy information is displayed alongside each student's name. Hand the phone to the chef or restaurant manager to show them the complete list. No printed sheets required.
Step 3: Navigating to a venue
Open the Locations screen. Tap any venue to see its address, phone number, and a "Navigate" button that opens Apple Maps (or Google Maps) with the GPS coordinates pre-loaded. Staff don't need to search for the address.
Step 4: Emergency contact
Open the Contacts screen. Tap the phone icon next to any staff member's name to call them directly. Tap the message icon to send an SMS. One tap from the app to a live call.
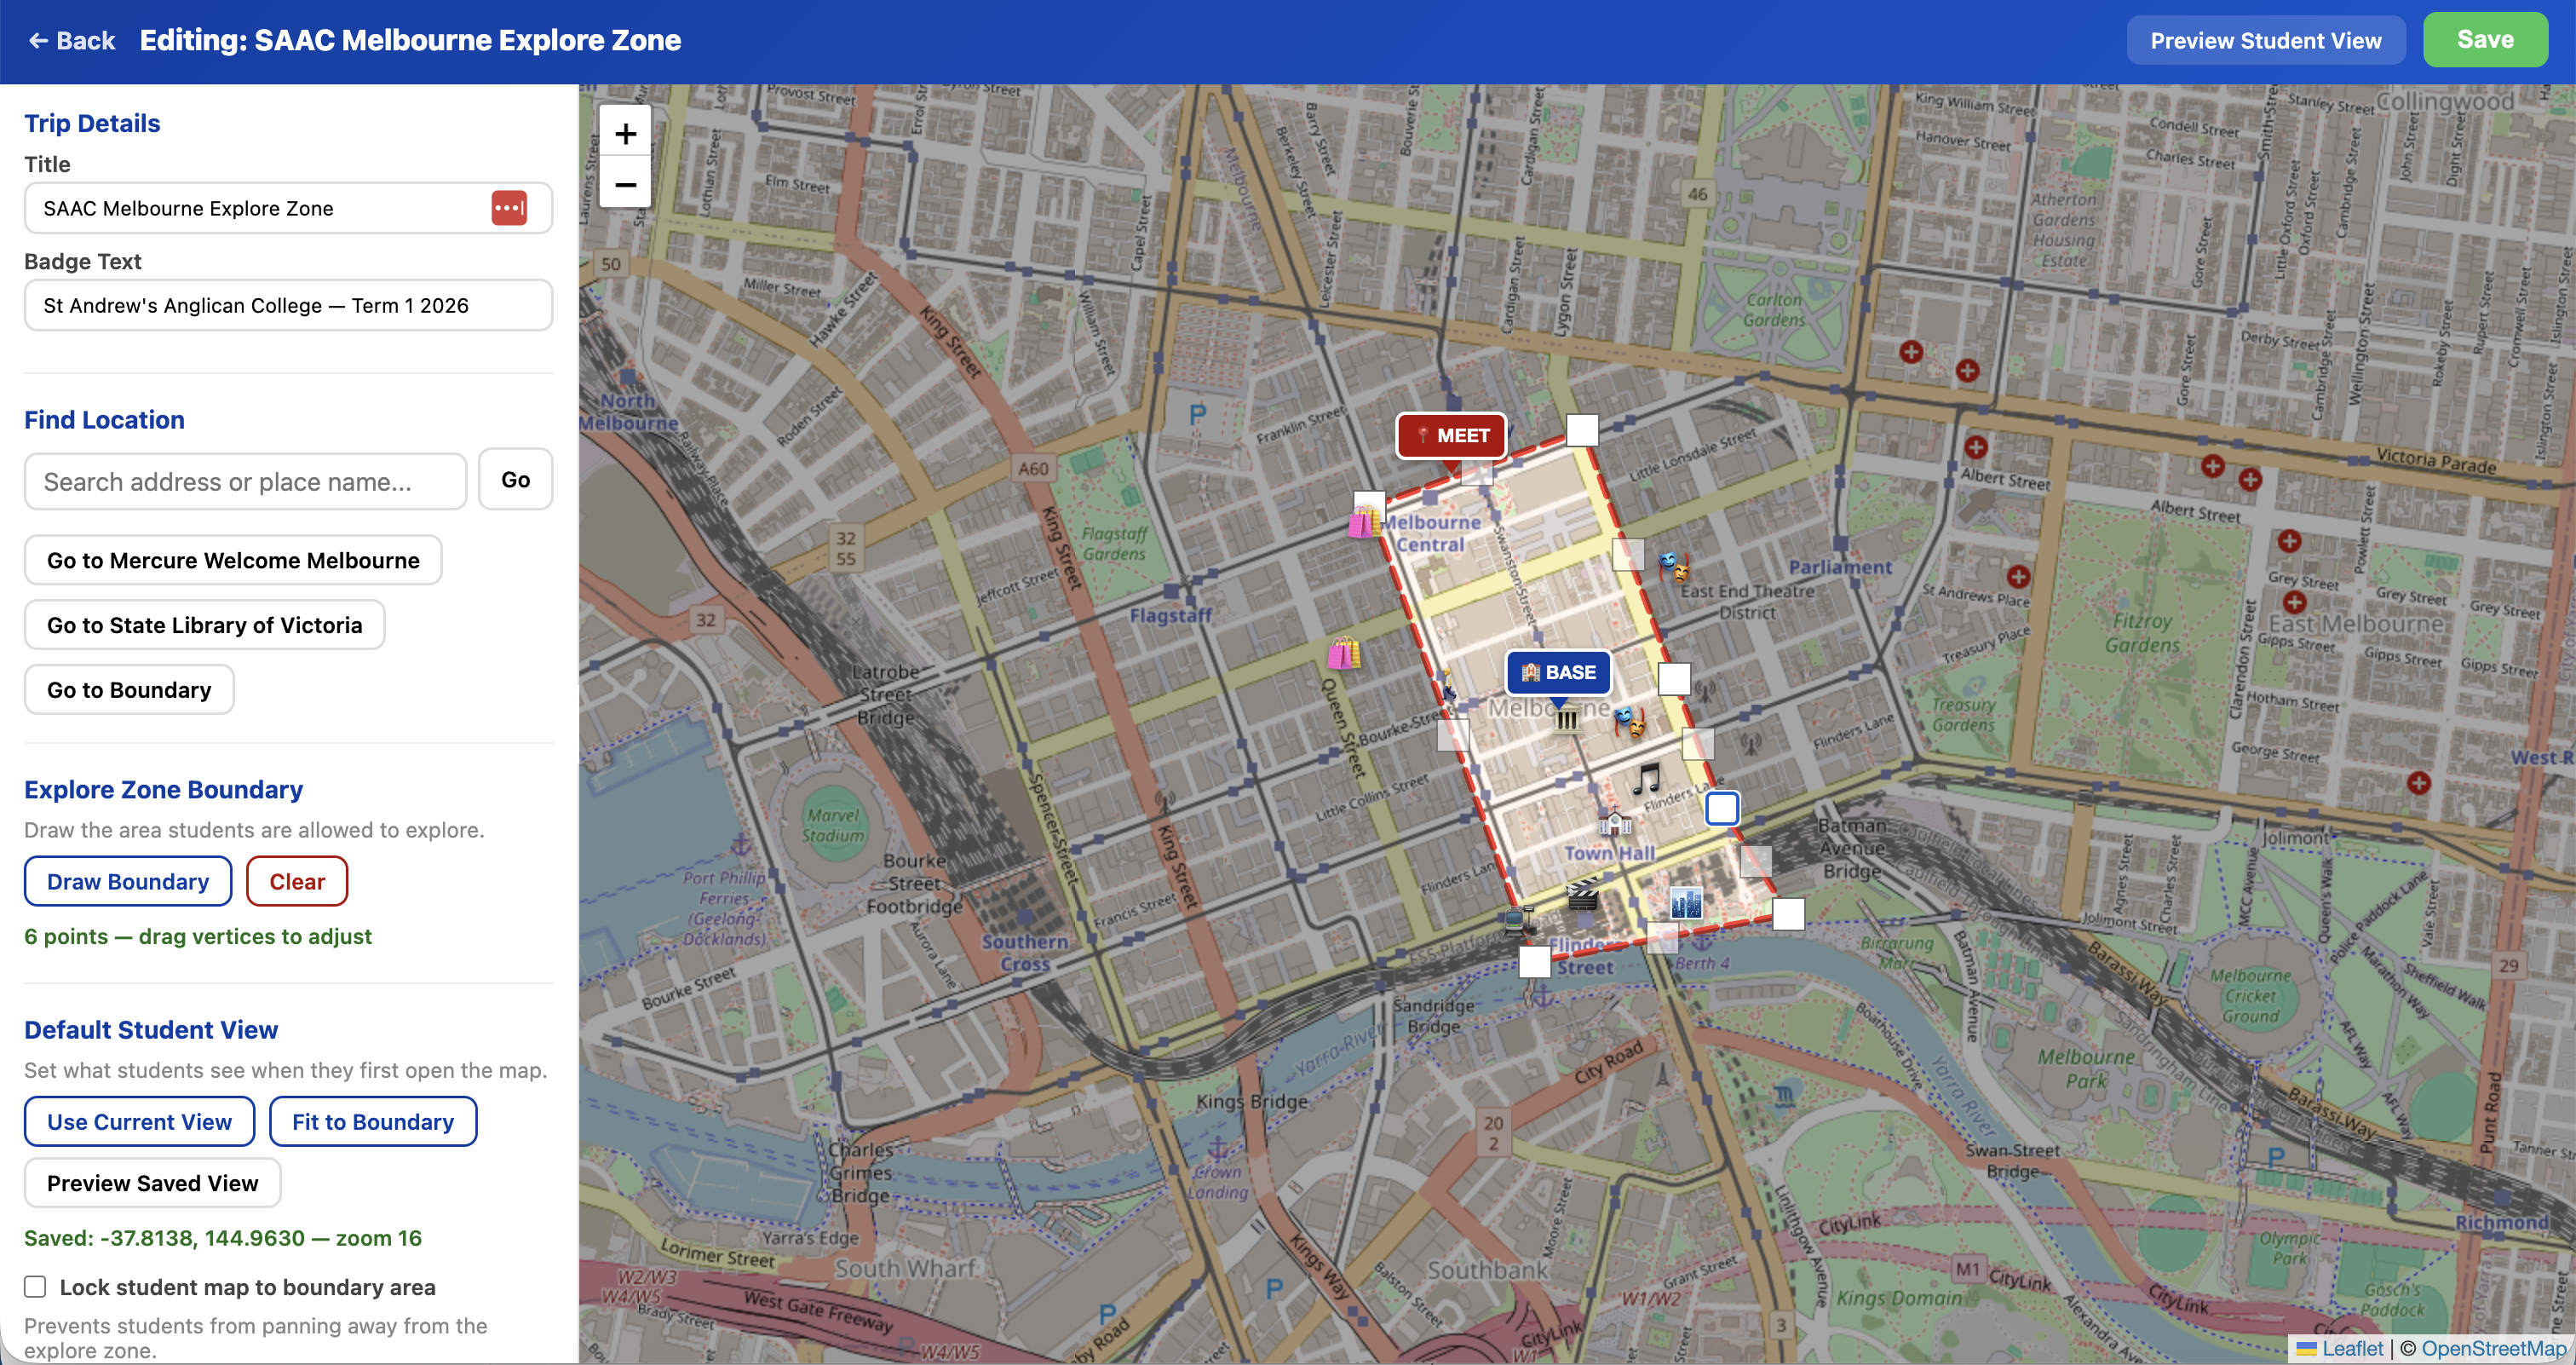
Explore Zones
Explore Zones gives students a live GPS map during free exploration time, showing their position within a defined safe boundary. Staff create and manage the zones through an admin interface.
Explore Zones was not planned before the trip. It was born during the trip itself. While demonstrating the existing platforms to a colleague in Melbourne, the conversation turned to student free-time and the colleague suggested a GPS boundary feature. I didn't have my laptop, but I had Claude on my iPhone. Standing in the city, I opened a voice conversation and described the idea aloud. Claude transcribed the discussion, worked through the technical approach, and generated a working prototype right there on my phone — an HTML file using Leaflet (an open-source mapping library) with real-time GPS positioning, polygon boundary detection, and status alerts. That evening, back at the hotel with my MacBook, I refined the prototype into a full-featured admin and student interface and deployed it as a live feature. The entire journey from a spoken idea to a deployed tool took hours, not weeks.
Setup (Before or During the Trip)
Step 1: Create a new zone
Open the Explore Zones admin panel. Tap "Create New Map." Enter a title (e.g. "Melbourne CBD Explore Zone"), a badge line (e.g. "Year 9 Melbourne Trip — Term 1 2026"), and a URL slug that becomes the student link.
Step 2: Draw the boundary
The admin interface shows a Leaflet map of Melbourne. Use the polygon draw tool to trace the boundary of the safe exploration area. Click to place points. Close the polygon. The boundary appears as a shaded region. Staff can edit the shape by dragging points, or redraw it entirely.
Step 3: Set the base location
Mark the hotel (or accommodation) on the map. Give it a label, name, and emoji. This appears as a prominent marker on the student map, so students always know how to get back.
Step 4: Set the meeting point
Mark the emergency meeting spot. Add help text (e.g. "Come here if you are lost or need help"). This is the fallback location if a student is disoriented or separated from their group.
Step 5: Add landmarks
Drop pins for points of interest within the zone: shops, attractions, restaurants, train stations. Each gets a name and emoji icon. These help students orient themselves and discover the area.
Step 6: Share with students
Copy the student link or generate a QR code. Display the QR on a screen, print it on a handout, or send the link via your school's messaging system. Students open the link on their phones. No app install required.
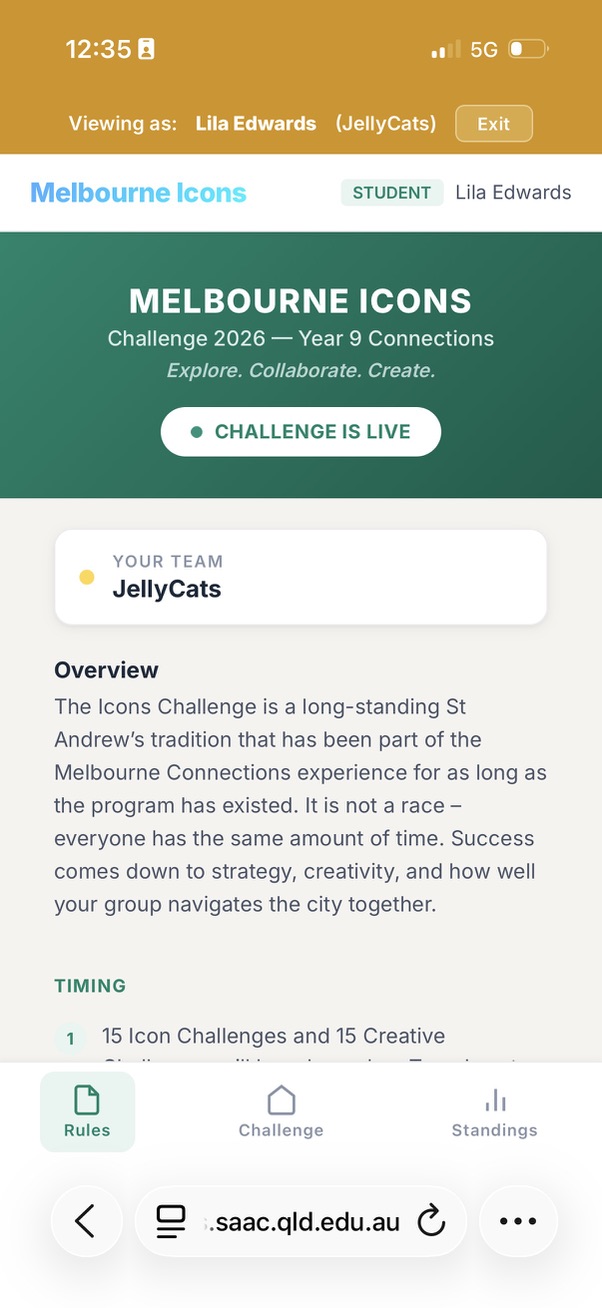
Student Experience
Students open the link on their phones and see a live map. A blue dot shows their real-time GPS position, updating every four seconds. The boundary is drawn as a red dashed line. A status bar at the top shows green ("Inside explore zone") or red ("Outside explore zone!") depending on their position. Tapping the hotel card flies the map to the base location. Tapping the meeting spot card flies to the emergency rendezvous. Landmarks are displayed as emoji markers with labels. The entire interface is designed to be immediately understandable with zero instruction.
Part 2: Melbourne Icons — Educator Workflow
Melbourne Icons is the real-time scavenger hunt platform. The workflow has three phases: challenge setup (before the event), live management (during the event), and results (after the event).
Challenge Setup (Days or Weeks Before)
Step 1: Create a challenge
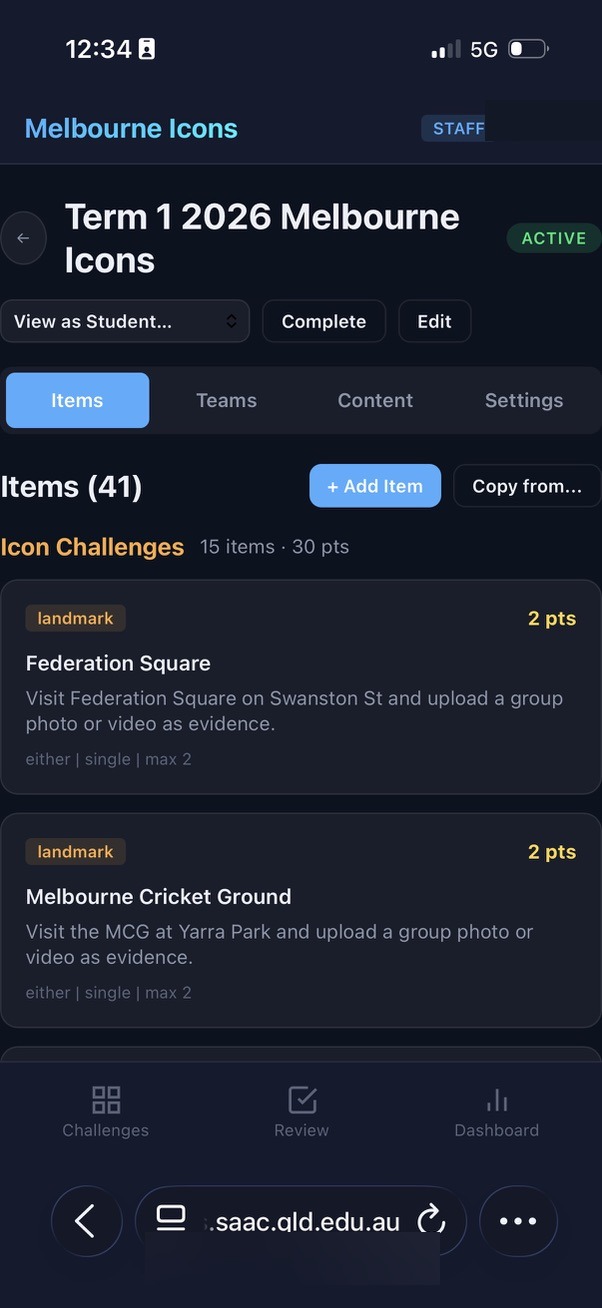
Open the Melbourne Icons staff dashboard. Navigate to Settings. Create a new challenge with a name, description, and optional start/end dates. The challenge starts in draft mode, invisible to students.
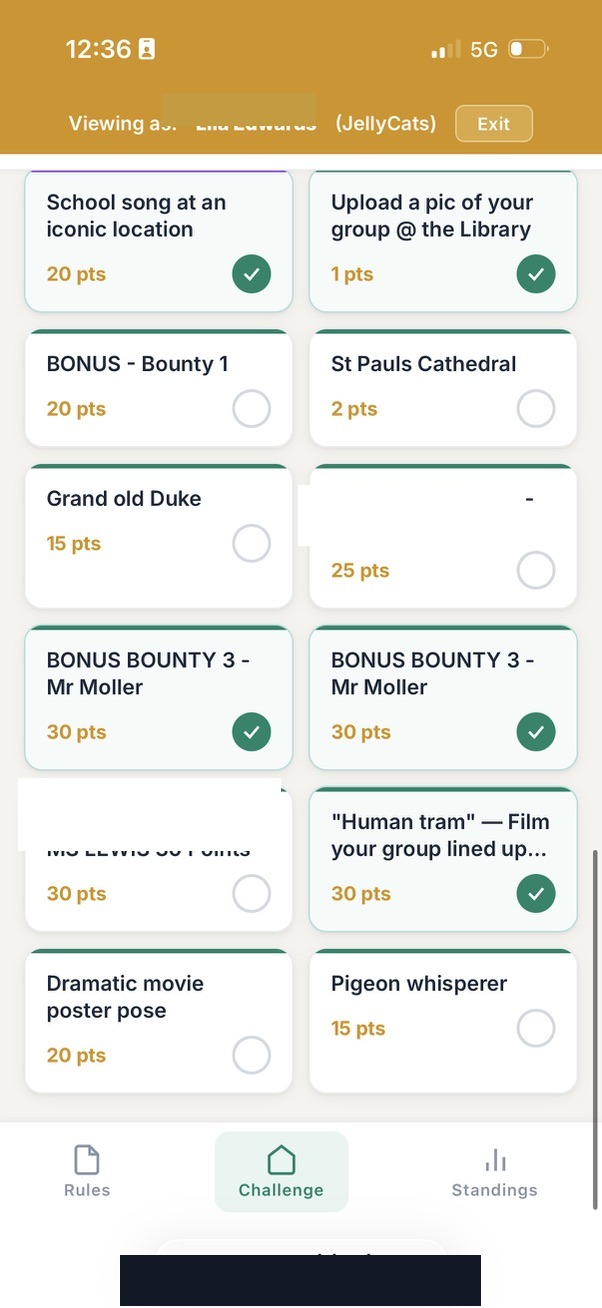
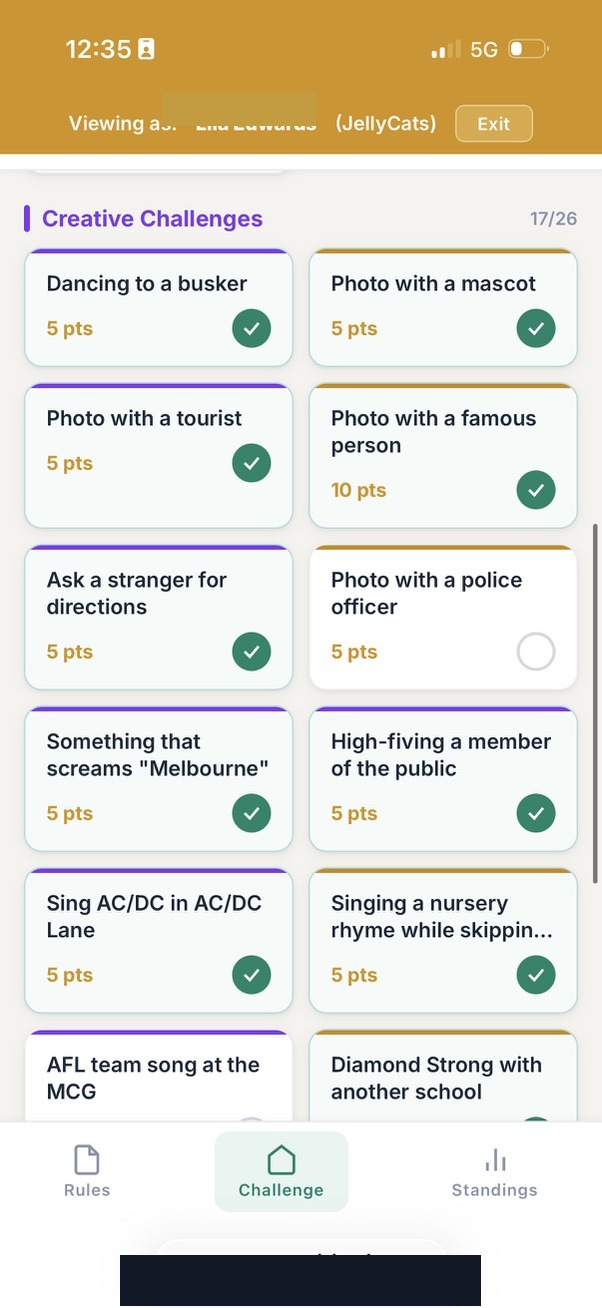
Step 2: Design the challenge items
Navigate to the Items tab. Add challenge items one by one. Each item has a title (e.g. "High-fiving a member of the public"), a category (landmark, culture, surprise, general), a point value, and a media type requirement (photo or video). For items that need subjective judging (e.g. "Singing a song at an iconic location"), set the scoring mode to "multi-judge" and configure the maximum number of judges (up to 5). The points for multi-judge items come from the average of all judge scores rather than a flat value.
Step 3: Configure bonus/hidden items
Any item can be marked as "bonus." Bonus items are hidden from students when the challenge is active but visible to staff with a [BONUS] tag. Staff can reveal bonus items at any time during the challenge by unticking the bonus checkbox. This enables surprise rounds, staff scavenger hunts (a staff member hides in the city and releases a riddle), or timed bonus windows.
Step 4: Set up teams
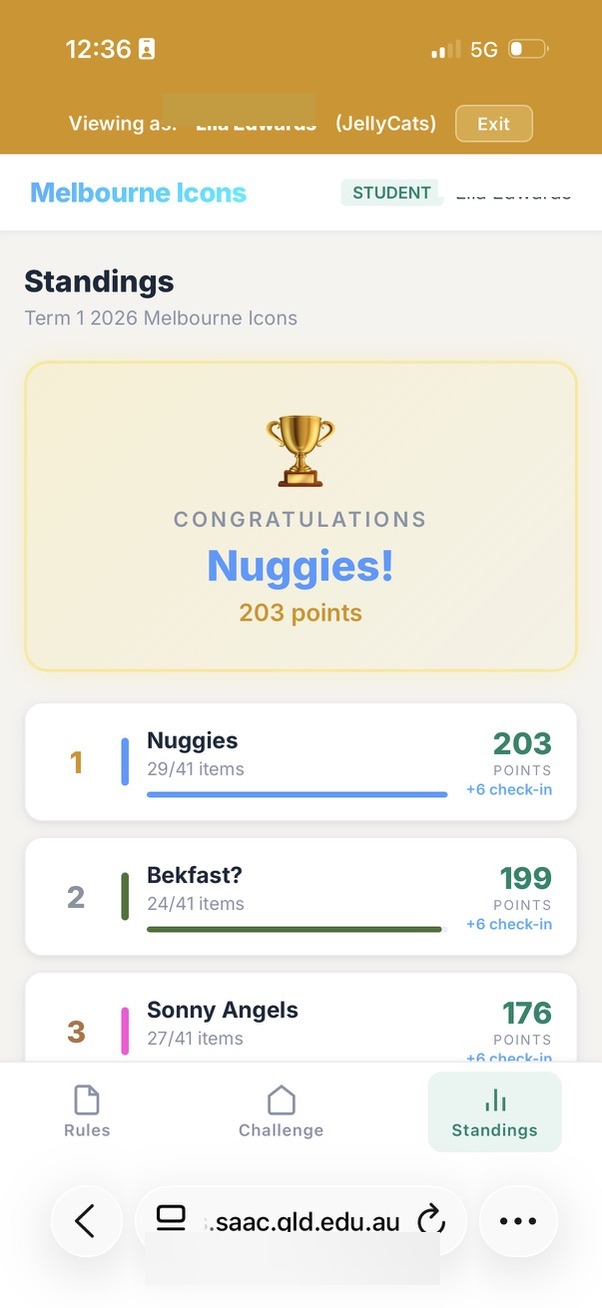
Navigate to the Teams tab. Create teams with names and colour assignments. Add students to each team. Team names are editable at any time (students can rename their own teams for fun). Each team gets a unique colour that appears on the leaderboard and throughout the interface.
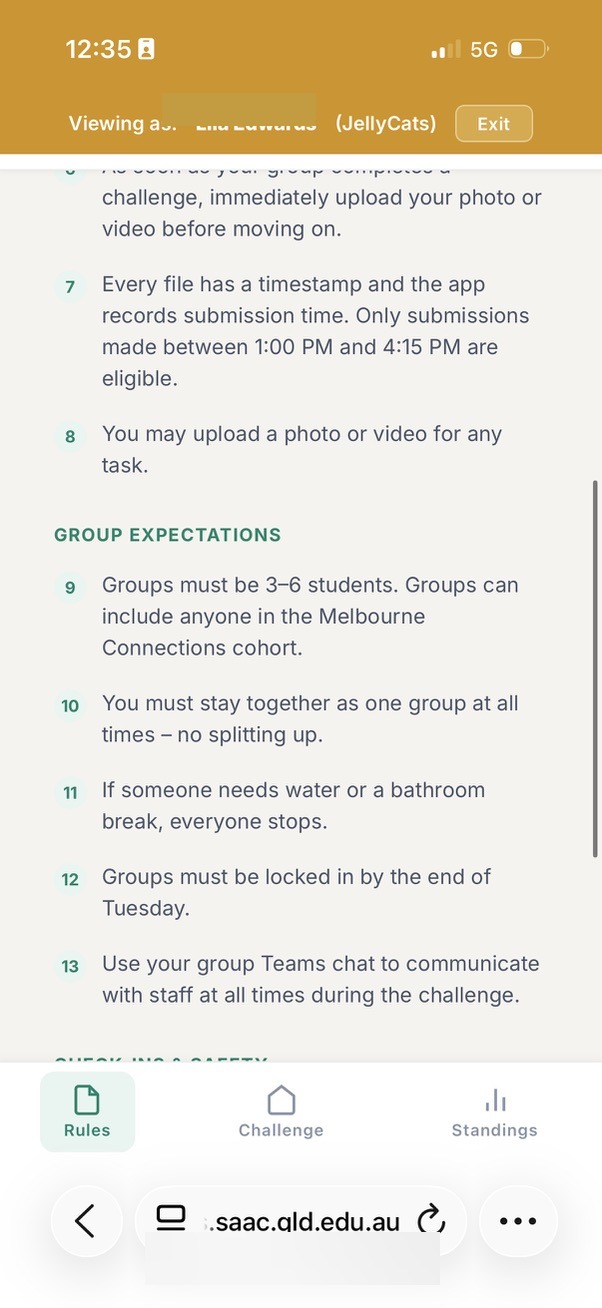
Step 5: Customise the student landing page
The student-facing page has a content editor where staff can write instructions, rules, and encouragement. This content appears when students first open the app, before they start submitting.
Step 6: Test with a practice submission
Create a test item (e.g. "Upload a pic of your group at the library") in the "test" category. Have a student or staff member submit a photo to confirm the full pipeline works: upload, review, scoring, leaderboard update. This can be done the day before or even the morning of the event.
Live Event Management
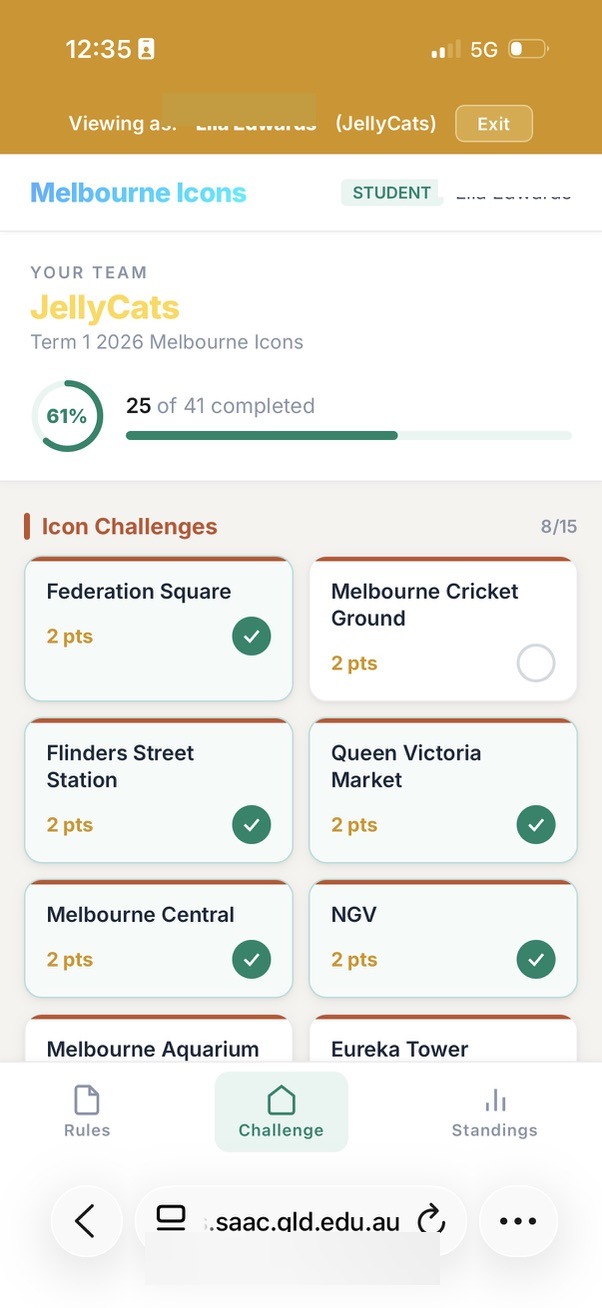
Step 1: Activate the challenge
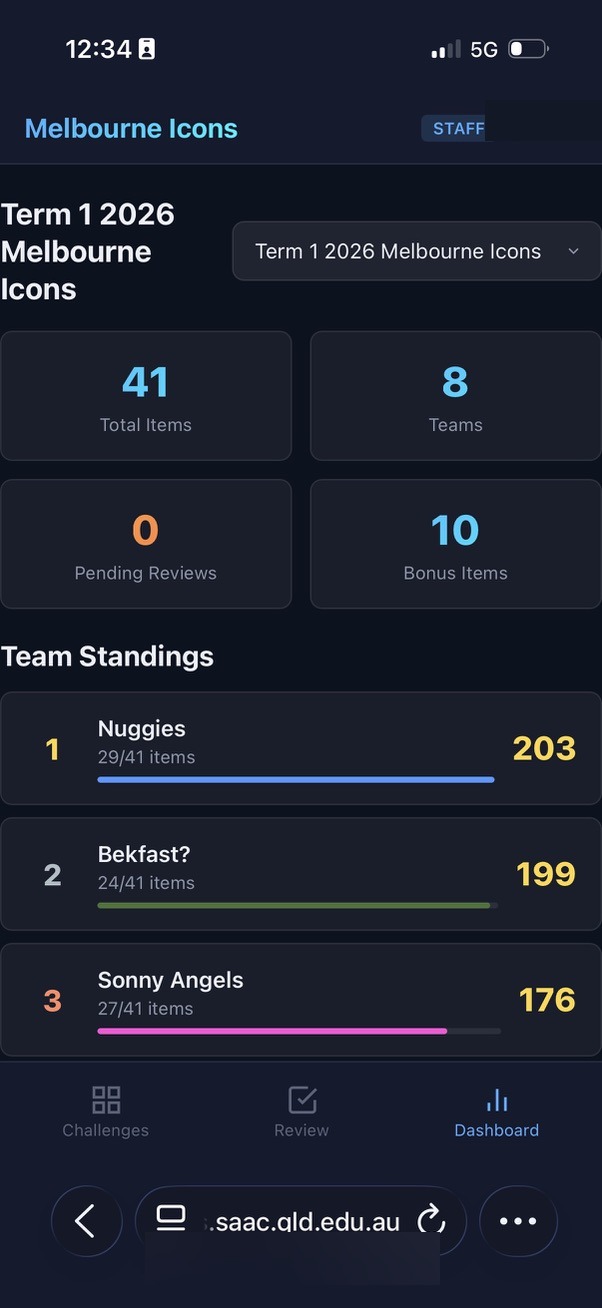
Set the challenge status to "active." Students can now see the challenge items and begin submitting. The Dashboard shows real-time statistics.
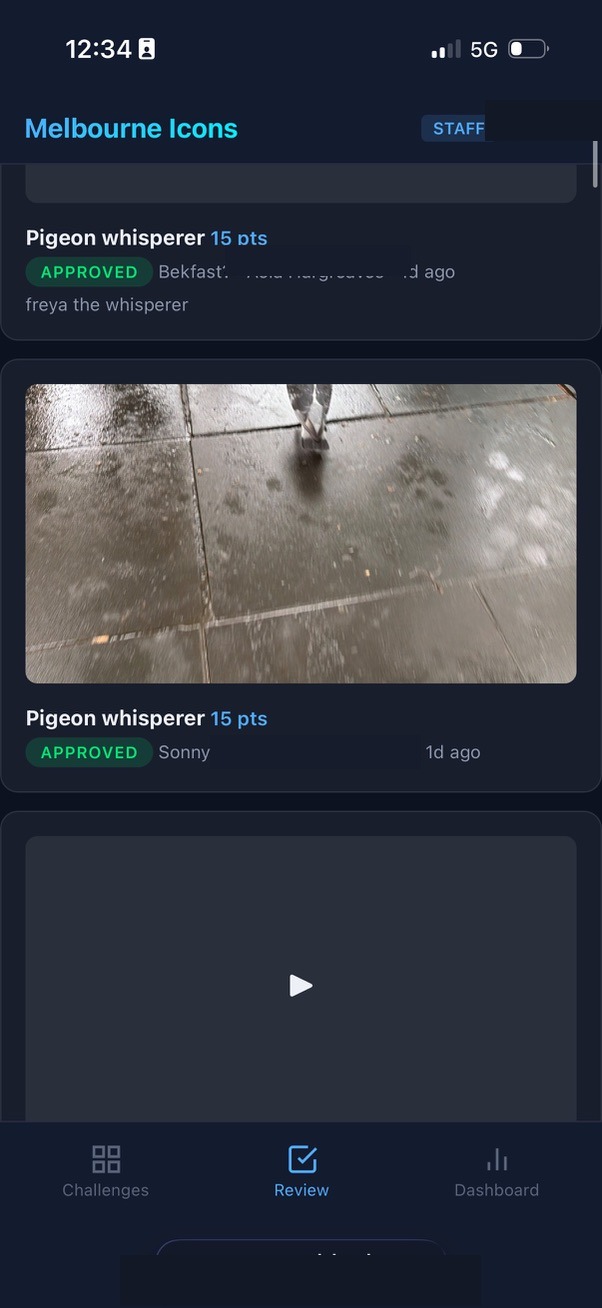
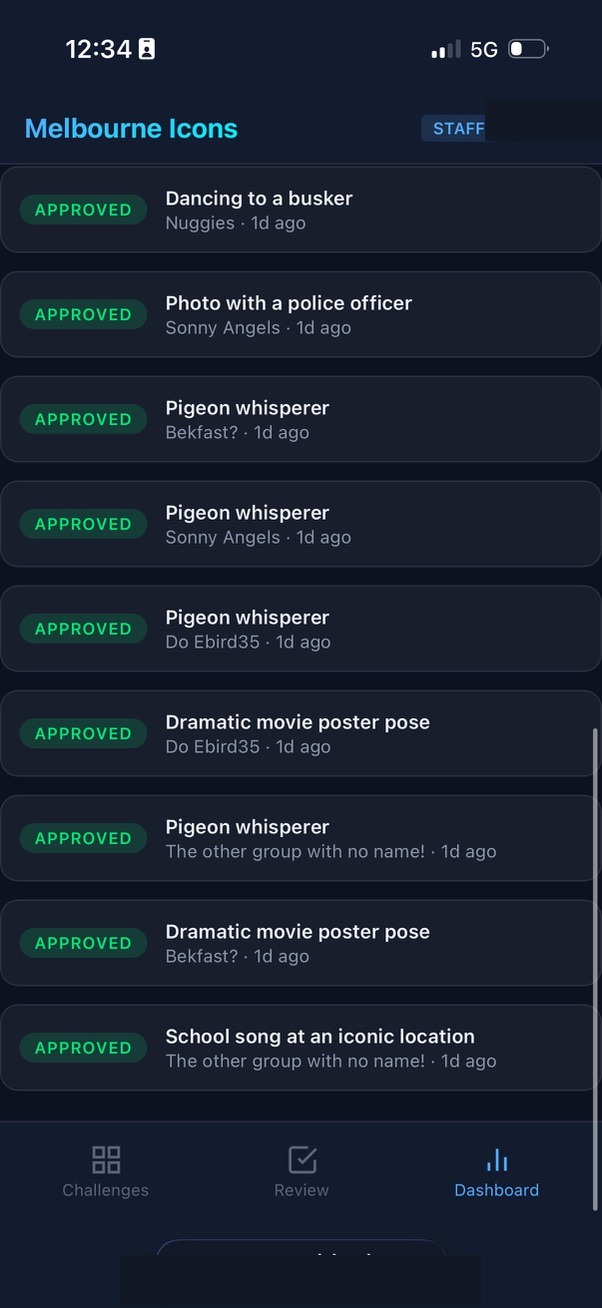
Step 2: Review submissions as they arrive
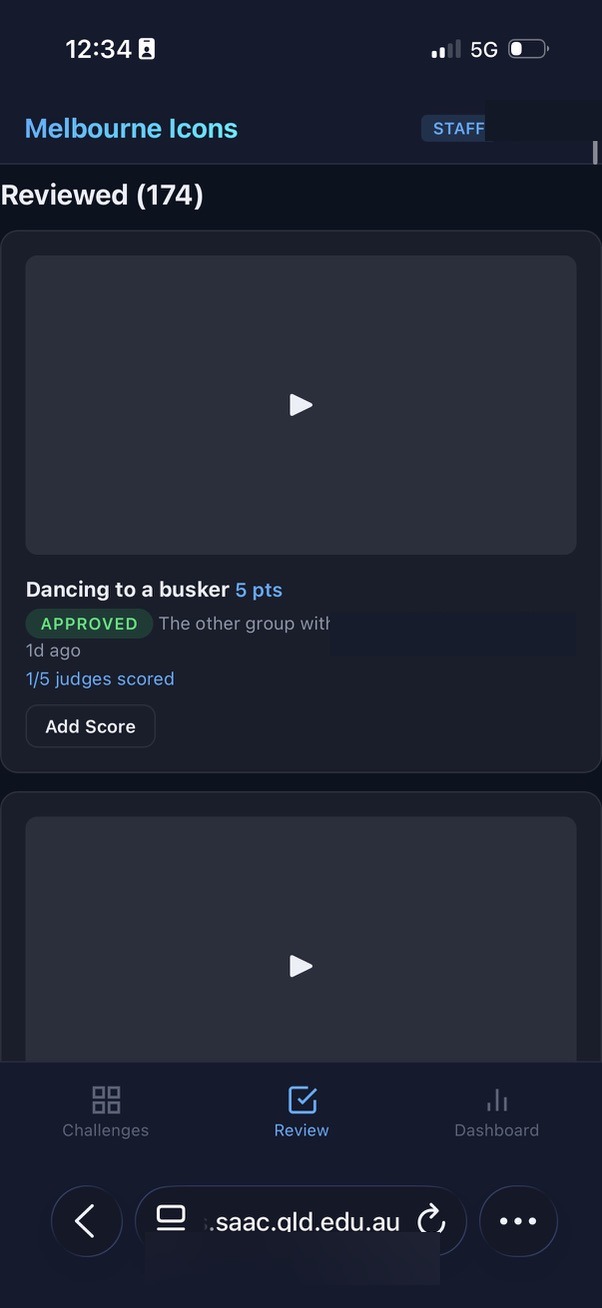
The Review screen shows incoming submissions in chronological order. Each submission card shows the team name, challenge item, media type, and a thumbnail. Tap to view the full photo or video. Approve or reject with a single tap. Add an optional rejection reason if declining a submission (e.g. "Can't see a high five"). For multi-judge items, the first approval triggers the item to count on the leaderboard immediately.
Step 3: Score judged items
Items with multi-judge scoring show a "Score" button. Tap to open the scoring modal, which displays any existing scores from other judges. Enter your score out of the maximum and an optional comment. The leaderboard updates automatically with the running average. The "Needs Your Score" section at the top of the Review screen highlights items where you haven't yet added your score, so nothing gets missed.
Step 4: Release bonus challenges
At any point during the event, navigate to the Items tab and untick the "bonus" checkbox on a hidden item. It immediately becomes visible to all students. Use this for surprise rounds, timed bonuses, or to inject energy when the pace slows.
Step 5: Monitor the Dashboard
The Dashboard shows total submissions, submissions by team, approval/rejection counts, and the current leaderboard standings. Use this to gauge how the event is progressing and whether teams are engaging.
Step 6: Record safety check-ins
The check-in feature lets staff log when teams check in at designated points. Check-in bonus points are added to the team's total automatically.
Results and Reveal
Step 1: Freeze the leaderboard
When the challenge window closes, navigate to Settings and tick "Pause Leaderboard." Students immediately see a "Final results are still being calculated... Stay tuned!" message with a pulsing animation instead of the standings. Staff still see the full leaderboard on the Dashboard and can continue reviewing and scoring.
Step 2: Complete final reviews and scoring
Work through any remaining pending submissions. The "Needs Your Score" section helps judges catch any items they missed. Take the time to get scores right without students watching numbers change in real time.
Step 3: Reveal the winner
When ready, untick "Pause Leaderboard" in Settings. Students refresh and see a celebration banner with the winning team's name, colour, and a glowing animation, followed by the full final standings. Time this for maximum impact: gather students together, count down, then unfreeze.
Part 3: The Development Workflow with AI
For readers wondering what it actually looks like to build software in partnership with AI, here is the workflow.
The Tool: Claude Code
Claude Code is a command-line AI development tool that runs inside a terminal window. What makes it powerful is not just that it can write code, but that it operates directly inside the developer's own environment. For the web platform (Melbourne Icons and the Explore Zones system), Claude Code worked across the full stack: database, backend, frontend, and deployment scripts. But it was the native iOS development — building the Staff Companion app in Apple's Xcode — where the power of this approach became most apparent.
Xcode is the professional development environment used to build every app on an iPhone. Traditionally, the learning curve is steep: the Swift programming language, Apple's interface frameworks, build configurations, provisioning profiles, device deployment. It is not a tool designed for casual users. Claude Code changes that equation entirely. It reads the existing Xcode project — every Swift file, every interface definition, every data model — and understands the patterns and conventions already established. When I describe a new feature in plain language, it writes Swift code that fits seamlessly into the existing architecture. The changes appear in Xcode in real time. I build the app, deploy it to my phone, and test it. If something needs adjusting, I describe what I see and the AI refines. The entire cycle feels less like programming and more like a design conversation with a technically fluent colleague who happens to type very fast.
This matters because it means an educator can build a native iOS app — not a web page pretending to be an app, but a genuine native application with offline capability, direct access to phone features like calling and GPS, and the performance and reliability that comes with running natively on the device. The learning curve that would normally take months of formal study is compressed into a conversational workflow where the educator focuses on what the tool should do and the AI handles how to make it happen in Swift and Xcode.
The Workflow
Step 1: Describe the problem in plain language
I open Claude Code in a terminal window alongside Xcode (for the iOS app) or my code editor (for the web platform) and describe what I need. Not in code. Not in technical jargon. In the language of someone who lives the problem: "I need staff to be able to freeze the leaderboard so students see a holding message while we finish scoring, then reveal the winner with a big celebration banner when we're ready."
Step 2: The AI explores and proposes
Claude Code reads the existing codebase, understands the database schema, the API routes, the frontend structure, and the coding conventions already established. It proposes an approach: "I'll add a leaderboard_frozen column to the challenges table, update the settings form with a toggle, modify the leaderboard API to return an empty standings array for students when frozen, and add a winner banner component to the frontend." I review the approach and agree, adjust, or redirect. For the iOS app, the same principle applies: the AI reads the Xcode project, understands the existing Swift views and data models, and proposes changes that are consistent with the app's architecture.
Step 3: The AI implements across the full stack
Claude Code writes the code — whether that's database migrations and JavaScript for the web platform or Swift views and data models for the iOS app. It modifies multiple files in a single pass, maintaining consistency with the existing code style. I watch the changes appear in real time.
Step 4: I test
For the web platform, I open the browser, click through the new feature, and test it as a staff user and as a student user. For the iOS app, I build in Xcode and deploy to my phone. If something isn't right, I describe what I see: "The frozen message looks good but the winner banner needs to use the team's colour, not just gold." The AI adjusts.
Step 5: Deploy
For the web platform, I copy the files to the production server. The process manager restarts the application. For the iOS app, I rebuild in Xcode and deploy to staff devices. The feature is live. The full cycle from "I have an idea" to "students can see it" was often under thirty minutes.
Part 4: What We Built on the Fly
This is the part that is hard to believe until you've lived it. The following features were not planned weeks in advance. They were conceived, designed, built, tested, deployed, and used during the live event or in the hours immediately surrounding it. Each one emerged from a real problem encountered in real time by real people managing a real experience.
The timeline below covers approximately eight hours, from the morning preparations through the post-challenge analysis. Every entry represents a working feature that went from idea to production.
Challenge Day: 2 March 2026
Morning Preparations
8:30 AM Student Guide Text Refinements
While reviewing the student-facing guide one last time before the challenge, I noticed the heading "Before You Leave School" didn't make sense for students already in Melbourne. I described the issue to the AI. Within minutes, the heading was changed to "Before You Leave" and the test submission instructions were reordered to appear right after the "Get Set Up" section, so the first thing students see after setup is how to do a test upload. Deployed before students woke up.
9:00 AM Staff Guide Update: Bonus Challenge Instructions
I realised the staff guide didn't explain the bonus/hidden item feature clearly enough. I described to the AI how the feature works and asked it to add a section with a concrete example: "A staff member hides in the city and releases a bonus challenge with a riddle. Students solve the riddle to find the staff member and earn bonus points." The AI added two new sections to the staff guide, complete with step-by-step instructions, and renumbered the existing steps. I deployed to production.
10:00 AM Multi-Judge Scoring Overhaul
A fundamental design change I made the morning of the event. The original scoring system required a fixed number of judges (e.g. 3 out of 3) before a multi-judge score would count on the leaderboard. Thinking through the reality of four staff members trying to judge submissions while also supervising students in a busy city, I realised this was too rigid. If even one judge didn't reach a submission, the score would never count. I described the problem to the AI: "Instead of required judges being a set limit, it needs to be up to 5 judges. Post the score as each judge scores it. If one doesn't get to the final score, just average it out." The AI redesigned the scoring engine. Changes spanned four files: the scoring service (changed the threshold from "scores >= required" to "scores > 0"), the submissions route (auto-approve on first score, enforce maximum judges, add judge count tracking), and the frontend (show judge count badges, enable scoring on already-approved items, display existing scores in the score modal). Tested, deployed, and working before the challenge started.
10:30 AM Microsoft Forms Backup Plan
I created a plain-text list of all thirty-one challenge items with point values as a backup, in case the primary system had issues and submissions needed to be collected via Microsoft Forms. The AI queried the challenge database and generated the formatted list. Never needed, but ready.
The Live Challenge: 1:00 PM – 4:00 PM
1:00 PM Challenge Goes Live
Seven teams depart. First submissions arrive within two minutes. The system handles everything smoothly.
1:50 PM Live System Health Check
Fifty minutes into the challenge, I asked the AI to run a health check on the production system. The AI examined the database files (128 KB main database, 3.9 MB write-ahead log), counted uploads (99 files across 7 team directories, 261 MB total), verified the most recent upload timestamp, and checked the server proxy was responding. Confirmed: zero issues, all seven teams actively submitting, the last upload was two minutes ago. Full confidence to keep pushing the experience.
2:00 PM Bonus Challenge Ideas Generated on the Spot
As the challenge progressed, I wanted to inject more energy. I asked the AI for quick bonus challenge ideas that students could complete in the final stretch. The AI generated a batch of creative options tailored to Melbourne locations and the program's "step outside your comfort zone" ethos. Staff selected their favourites and released them as surprise bonus items through the existing bonus challenge feature.
2:30 PM "Already Scored" Error Fix
A staff member tried to update their score on a submission and hit an error: "You have already scored this submission. Use PUT to update." I screenshot the error and sent it to the AI. The AI diagnosed the issue immediately: the frontend was using a POST request (create new score) when it should use PUT (update existing score) for judges who had already scored. Within minutes, the AI implemented an automatic retry mechanism. If the POST fails with "already scored," the frontend silently retries with PUT to update the score instead. No more error messages. Deployed while the challenge was still running. Staff never saw the error again.
3:00 PM "Needs Your Score" Review Section
With multiple judges scoring different submissions at different times, it was hard for staff to know which items they still needed to score. I described the problem: "Put at the top of the review screen all of the submissions where the current user hasn't given a score yet." The AI added a current_user_scored flag to the backend API response, then built a "Needs Your Score" section at the top of the Review screen that filters for multi-judge items where the logged-in staff member hasn't scored yet. Each card shows how many judges have scored so far (e.g. "2/5 judges scored") with a prominent "Add Score" button. Deployed while staff were actively scoring.
3:30 PM Leaderboard Freeze Feature
The challenge window was closing. Staff needed time to finish reviewing and scoring the final submissions, but I didn't want students watching the leaderboard shift in real time as the last scores trickled in. The reveal should be a moment, not a gradual trickle. I described the idea: "Can we add a toggle for staff to pause the leaderboard? Students see 'Final results still being calculated' and then when I toggle it off, it's live with the final results and a big flashing banner congratulating the winning team." The AI designed and built the entire feature from scratch:
- Database: Added a leaderboard_frozen column to the challenges table
- Backend API: Modified the leaderboard endpoint to return empty standings for students when frozen, while staff still see full data
- Settings UI: Added a checkbox toggle ("Pause Leaderboard") in the staff settings panel
- Student view: Built a "Results being calculated" card with a pulsing timer animation
- Winner banner: Built a celebration component that detects the first-place team, displays their name in their team colour with a glowing gold border animation
- CSS animations: Created keyframe animations for both the frozen state and the winner reveal
Six files modified. Tested across staff and student views. Deployed. I froze the leaderboard while judges finished scoring. When the final scores were in, the leaderboard was unfrozen in front of the gathered students. The winning team's name appeared in a pulsing gold banner. That moment, the one that made the whole day feel like it had a proper ending, was built in under thirty minutes during the event itself.
After the Challenge
5:00 PM Production Database Backup and Analysis
With the challenge complete, the AI helped me secure a snapshot of the production database for analysis. The production database runs on a remote Windows server, and direct access over the network mount was blocked by SQLite's file locking. The AI worked through the problem, copying the database locally and then running comprehensive queries against the snapshot.
5:30 PM Challenge Day Review: Written from Data
I asked the AI to write an exciting review of the challenge day, "like it was an amazing sporting battle between the teams." The AI queried the database for every submission timestamp, score, team, category, and landmark. From this raw data, it reconstructed the narrative of the day: which teams started fastest, who went to the furthest landmarks, which teams dominated the culture challenges, who pushed to the final minute. The result was a detailed, engaging, sports-commentary-style review grounded entirely in real data. Saved to my desktop, ready to share with students.
6:00 PM Technical Health Report
I asked for a developer-focused performance analysis. The AI examined submission rates (peak: 6 per minute), file sizes (average photo: 0.62 MB, average video: 1.37 MB), review turnaround distribution (40% reviewed in under 1 minute), rejection analysis (2 out of 83, a 2.4% rate), judge scoring patterns (one judge handled 67% of all scores), database performance (WAL mode, healthy, no contention), and network reliability (zero upload failures). The report translated these metrics into actionable recommendations for the next deployment. It also identified what the data meant for the quality of the student experience: the 2.2-minute average review meant students stayed engaged because feedback was fast; zero upload failures meant no moment of creative courage was lost to a technical glitch.
7:00 PM Per-Team Statistics for Students
I wanted fun team statistics to share with students the next day. The AI ran a detailed analysis of each team: submissions per hour, fastest back-to-back submission (one team managed 11 seconds between uploads), categories completed, landmarks visited, judge score averages, total data uploaded, and estimated walking distance based on which Melbourne landmarks each team tagged. The document included superlatives: "Most Challenges Completed," "Furthest Distance Walked," "Fastest Back-to-Back," "Highest Judge Scores." Ready to read out at breakfast the next morning.
The Count
In a single day, the following was conceived and shipped to production:
- Student guide text and layout refinements
- Staff guide bonus challenge documentation (2 new sections)
- Complete multi-judge scoring engine redesign (4 files, new scoring logic)
- Backup submission plan (challenge list export)
- Live system health check and analysis
- On-the-spot bonus challenge content creation
- Auto-retry scoring fix (frontend error handling)
- "Needs Your Score" review prioritisation (backend + frontend)
- Leaderboard freeze and winner reveal (6 files, database change, 2 CSS animations)
- Challenge day narrative review (data-driven, 2,000+ words)
- Technical health report with recommendations (3,000+ words)
- Per-team statistical analysis with walking distance estimates
Twelve distinct deliverables. Three of them (the scoring fix, the "Needs Your Score" section, and the leaderboard freeze) were built and deployed while students were actively using the system. The students never noticed a thing. The staff barely paused. The system kept running.
This is what becomes possible when the person who understands the experience is the same person shaping the tool, with an AI partner capable of turning intent into working software in real time.
A Note on Process
This document, like the main paper it accompanies, was itself produced through my partnership with AI. The timelines and technical details were reconstructed from the actual development conversation logs. The AI had access to the full history of every feature request, every bug fix, every deployment, and every database query from the day. It helped me identify which moments were most significant, organise them chronologically, and articulate why each one mattered.